How much bandwidth does speech need?
🇩🇪 Post ist auch verfügbar auf deutsch.
Playing around with scipy for fun (and other reasons not easily explained), I plotted the spectrum of a short recording of my voice:
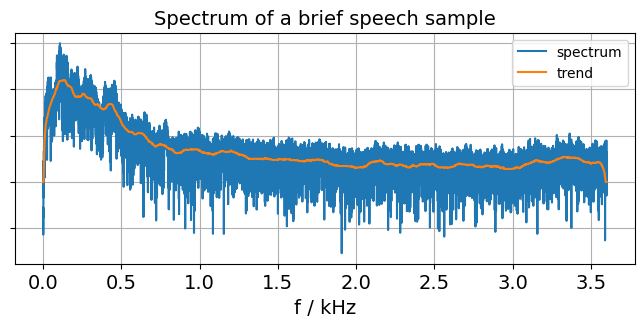
Image description for details and accessibility: This shows an x/y graph. The x direction shows the frequency in kHz, from 0 to about 3.7 kHz. The y axis shows logarithmic amplitude. (Lazy me was only interested in a qualitative view, so I did not bother to think about and find out how many y units come out as how many dB. So there are no numbers at the y axis.) There are two graphs: One is a rather noisy graph of the raw data, in blue. Overlaid is a smoothed version of the same data, labeled “trend”. Both start with very low values at 0 Hz, increase quickly until reaching a peak at maybe 150 Hz. From there, it is a steady, almost linear decline until about 800 Hz. Next, there is an almost imperceptible, much smaller decline until about 2 kHz. From there towards higher frequencies, the spectral amplitude remains pretty much constant. There is an additional brief decline of the trend line at the last 50 Hz or so at the high-frequency end of the graph. This does not correspond to anything visible in the raw data graph. I have reason to believe this is an artifact of how the trend line is calculated. In other words, it is spurious and can be ignored.
Looking at that graph, I noticed that there seems to be very little signal higher than 1 kHz. Preparing for my exam, I’ve learned telephony needs a bandwidth of 300 - 2700 Hz. This spectrum plot does not seem to agree.
So I put it to the test and threw together a few low-pass filters.
The filtered recordings you can hear for yourself:
- Low pass filtered with 1000 Hz cutoff:
- Low pass filtered with 1500 Hz cutoff:
- Low pass filtered with 2000 Hz cutoff:
- Low pass filtered with 2500 Hz cutoff:
- Low pass filtered with 2700 Hz cutoff:
- Original recording:
Even the 1000 Hz low-pass-filtered version, while certainly not sounding pretty, is perfectly comprehensible. In the absence of noise, it would earn a solid “readability 5” from me.
How did I do it? 🔗
To filter, I used the scipy Python FLOSS, and came up with code like this:
import numpy
import scipy

rate, frames = scipy.io.wavfile.read("Sprechprobe.wav")

TAPS = 128 # Should be adjusted if your sample rate isn't 8000 like mine.

for cutoff_frequency in [1000, 1500, 2000, 2500, 2700]:
    firs = scipy.signal.firwin(TAPS, cutoff_frequency, width=cutoff_frequency // 5, fs=rate)
    filtered_frames = scipy.signal.lfilter(firs, 1.0, frames)
    factor = min(-16000/min(filtered_frames), 16000/max(filtered_frames))
    sound_frames = numpy.array([round(fr * factor) for fr in filtered_frames], dtype=numpy.int16)
    scipy.io.wavfile.write(f"Sprechprobe_lowpassfiltered_{cutoff_frequency}.wav", rate, sound_frames)
You may use that piece of Python code under the terms of the CC0 1.0 Universal license. In other words, I place it into the public domain.
Discussion opportunity 🔗
If you want to comment or discuss this piece and have a Fediverse account, feel invited to answer my pertinent toot.